Two Samples
Hypothesis
Practice Question 1
In a test of the reliability of products produced by two machines, machine A produced 15 defective parts in a run of 280, while machine B produced 10 defective parts in a run of 200.
Do results imply a difference in the reliability of these two machines?
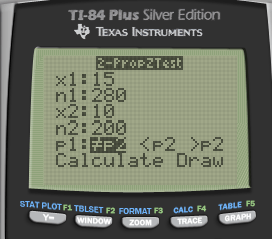
Data
P1 = 15/280 = 0.0536
P2 = 10/200 = 0.05
1: Machine A
2: Machine B
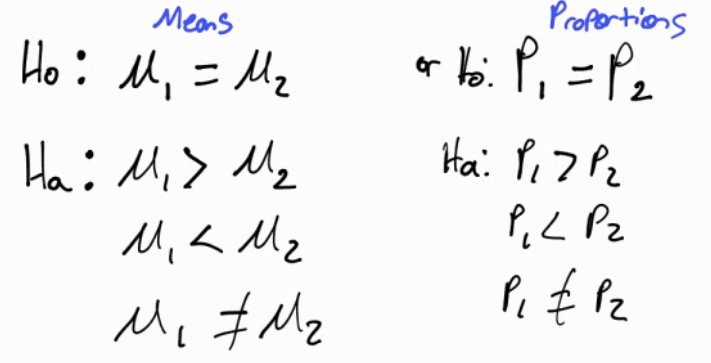
Hypothesis
H0: P1 = P2
H1: P1 ≠ P2
Conditions
Random: assumed
Independent: Each part produced is independent
Normal: n1*p1 > 10, n1*(1-p1) > 10, n2*p2 > 10, n2*(1-p2) > 10
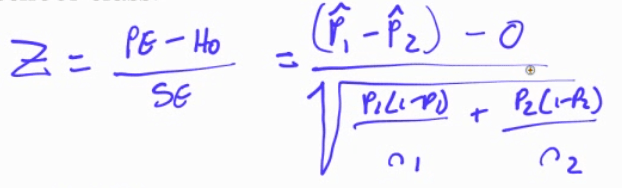
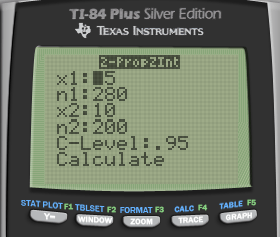
Calculate
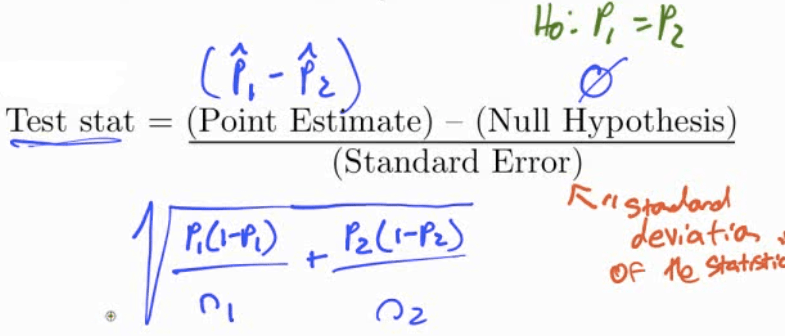
Calculate by calculator
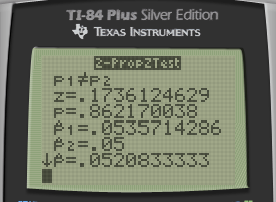
Interpret
- P > α, so we fail to reject the null hypothesis. We do not have evidence to support the claim that two machines have different reliabilities
Practice Question 2
The use of helmets among recreational alpine skiers and snowboarders are generally low. A study wanted to examine if helmet use reduces the risk of head injury.
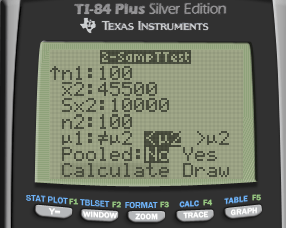
In the study, they compared the ski/board related injury costs for those who wore helmets and those who did not wear helmets. The helmet wearers had a mean injury cost of $10,200 per person (SD = $25,000) and the non-helmet wearers had a mean injury cost of $45,500 (SD = $10,000).
Are ski/board injuries less severe among those who wear helmets?
Hypothesis
H0: µ1 = µ2
H1: µ1 < µ2
Conditions
Random: assume SRS
Independent: assume each person independent
Normal: n1 > 30, n2 > 30
Calculate
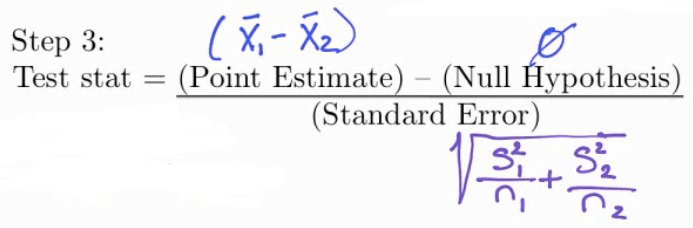

df = smaller n - 1
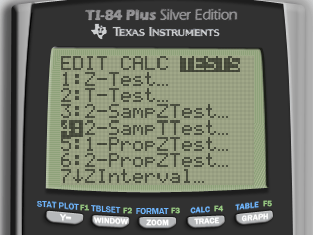
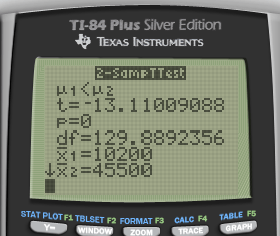
Calculate by calculator
Interpret
P < α
So we reject the null hypothesis and have evidence to support the claim that the injury cost of group 1 (helmet wearers) is less than group 2 (non-helmet wearers)
Practice Question 3
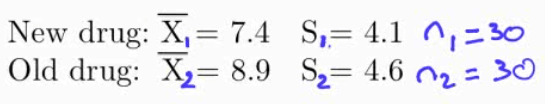
A pharmaceutical company claims its new drug will relieve headaches faster than any other drug on the market. To determine whether this claim is valid, the new drug is given to each of the 30 randomly selected persons and a standard drug is given to another 30 randomly selected persons.
The number of minutes required for each to recover from the headache is recorded. The sample results are:
Hypothesis
H0: µ1 = µ2
H1: µ1 < µ2
Conditions
Random: given
Independent: assumed
Normal: n = 30
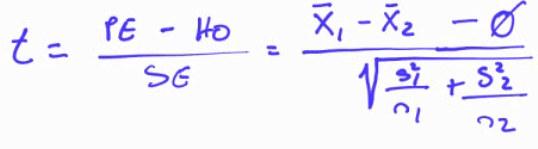
Calculate
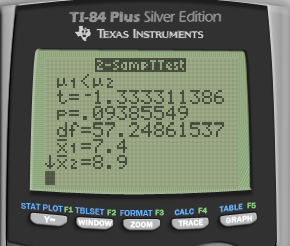
Interpret
P > α
We fail to reject H0, so we do not have evidence to support the claim that the new drug works better
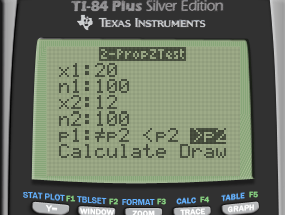
Practice Question 4
In a large university in the year 2000 an SRS of 100 entering freshmen found that 20 finished in the bottom third of their high school class. Admission standards at the university have become more stringent and in 2015 and a new SRS of 100 entering freshmen found that 12 finished in the bottom third of their high school class.
Does it appear that t he admission standards have actually become more stringent?
Data
P1 = x1 / n1 = 20/100 = 0.2
P2 = x2 / n2 = 12/100 = 0.12
Hypothesis
H0: P1 = P2
H1: P1 > P2
Conditions
Random: given, SRS
Independent: assumed
Normal: n1*p1 > 10, n2*p2 > 10, n1*(1-p1) > 10, n2*(1-p2) > 10
Calculate
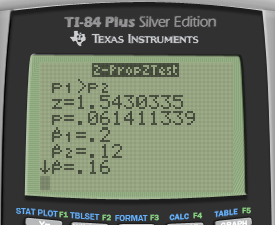
Interpret
P > α
So we fail to reject the null hypothesis and do not have evidence to support the claim that acceptance is more stringent
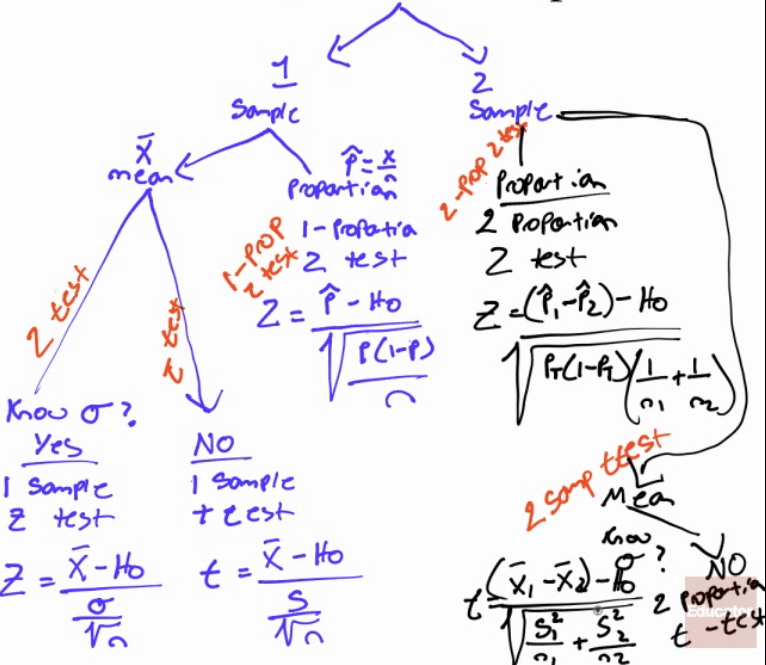
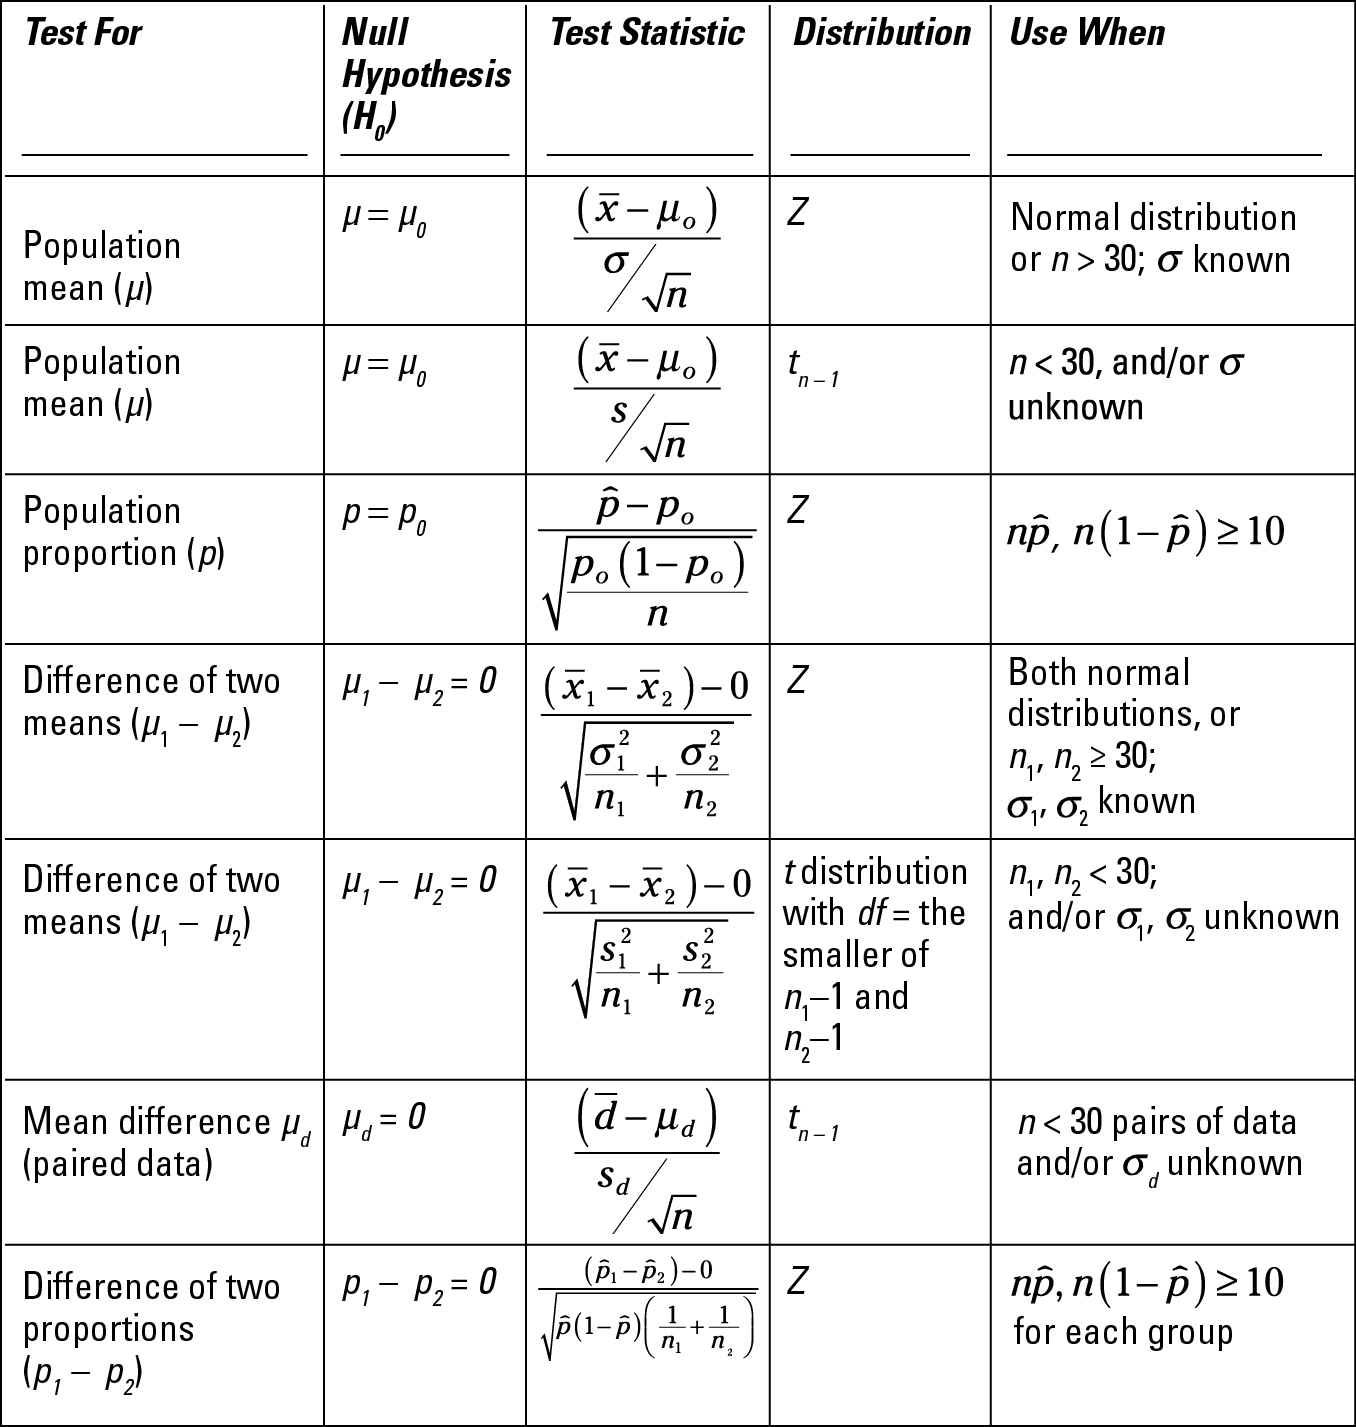
"Pick Your Test" Map
Confidence Interval Practice Question
In a test of the reliability of products produced by two machines, machine A produced 15 defective parts in a run of 280, while machine B produced 10 defective parts in a run of 200.
Do results imply a difference in the reliability of these two machines?
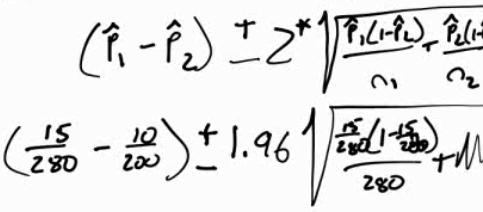
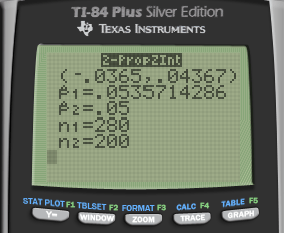
- 0 is in the interval so there does not appear to be difference